DIGITAL SENSOR PAD, THE BEST TOOL FOR SADDLE FITTING.
We use the digital sensor pad because it is a scientific measurement tool that provides objective data for an optimal saddle fitting.
The digital sensor pad is a matrix-based tactile surface sensor that works by the principle of piezoresistance. Tiny sensing cells cover the entire surface area of the sensor “skin” allowing for discrete spot pressure analysis at any point in the contact region.
Data is sent from the digital pad in real time via a Wi-Fi connection to an imaging software. This allows to see the impact of the saddle on the sensitive areas of horse’s back, in motion with the rider!
779 sensors generate a very accurate map of pressure of the horse back. Therefore, we are able to perfectly fit the saddle.
We check our first adjustement by a second scan for validation. We repeat this cycle till we get the perfect adjustment.
We could discover that your saddle is absolutly not adapted for your horse. It is not a good news, but it explains many problems. Buying a new saddle is not an easy task, we are here to help!

ANALYSIS PROTOCOL
Static analysis: measurement of the support area, length, stiffness or possible saddle defect.
We observe how the client sets and positions the saddle
Installing saddle on pressure sensor pad.
Identification of sensitive areas on the images: scapulas, withers and spine.
Analysis with rider at 3 gaits. The real-time image is retransmitted on a 32 “screen so that the analyst and the customer can see the results together.
Data interpretations and adjustment proposal.
Validation of the new adjustments by a new series of tests.
ANALYSIS CRITERIA
Stability and center of gravity.
Protected sensitive areas: Scapulas (shoulders), column and withers, and more rarely the lumbar area.
Optimal weight distribution of the rider on the portage area.
Stability of the saddle.
EXAMPLES OF IMAGES GENERATED BY THE SENSORS:
Understanding Imaging

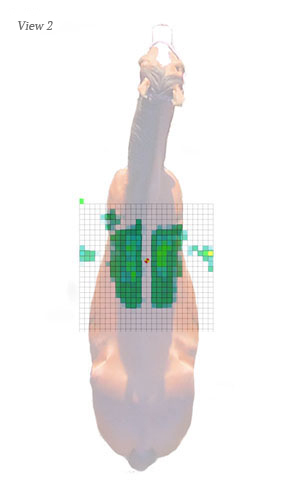
The images generated by the sensors are such that we could see them in a view from above. Here are two images that allow us to visualize the pressure zones on the back of the horse relative to the areas that can accommodate (in green) and can not accommodate (in red) the weight of the rider (View 1). Note that the marks on each side of the digital image (View 2) represent the saddle straps.
Example of a good weight distribution of the rider
Here is an example where the weight distribution of the rider is ideally distributed on the horse’s back.
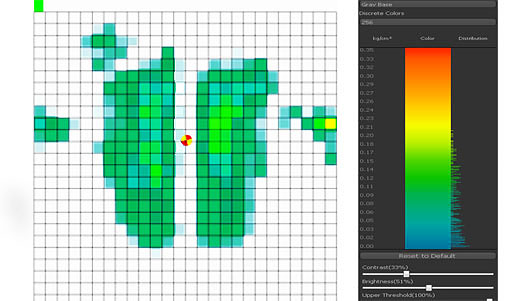
Complete release of the spine and withers.
The scapulas (shoulders) are well cleared allowing a free movement of the anteriors.
The weight of the rider is well distributed on the portage area.
The weight of the rider is well located above the 13th vertebra.
There is no pressure point.
Example of incorrect weight distribution of the rider
Here is an example of a bad weight distribution of the rider on the horse’s back.
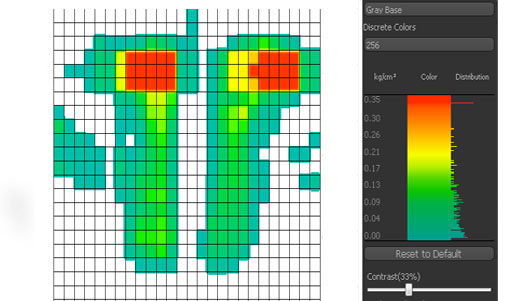
Incomplete clearance of the spine.
The scapulas (shoulders) are compressed, it can cause sharp pain.
The rider’s weight is on the front and therefore poorly distributed on the portage area.
The center of gravity is at the front of the 13th vertebra.
The pressure is concentrated on two areas.
Example with a treeless saddle
Here’s an example where the rider uses a treeless saddle.
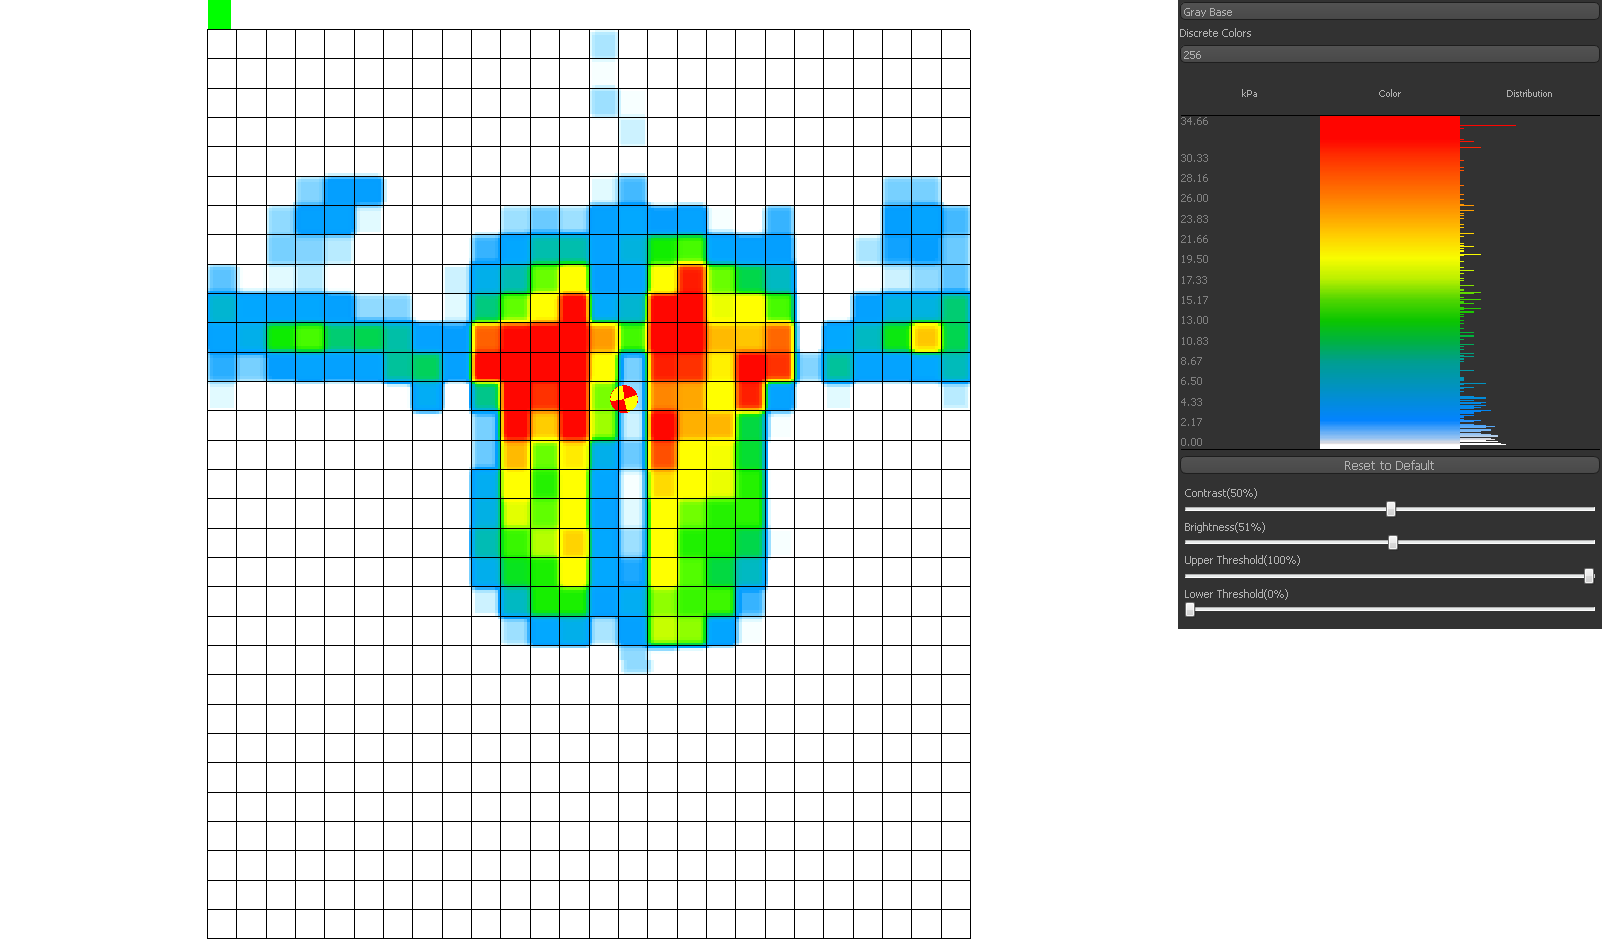
The spine is compressed.
The pressure zones touch the scapulas.
The weight of the rider is concentrated on small surfaces on the portage zone. The pressure zones touch the scapulas.
The center of gravity is correctly located.
There are 2 pressure points mainly on the portage area but touching on the spine.
Weight distribution of rider when riding bareback.
Here is an image taken during a bareback ride with a rider about 45kg .
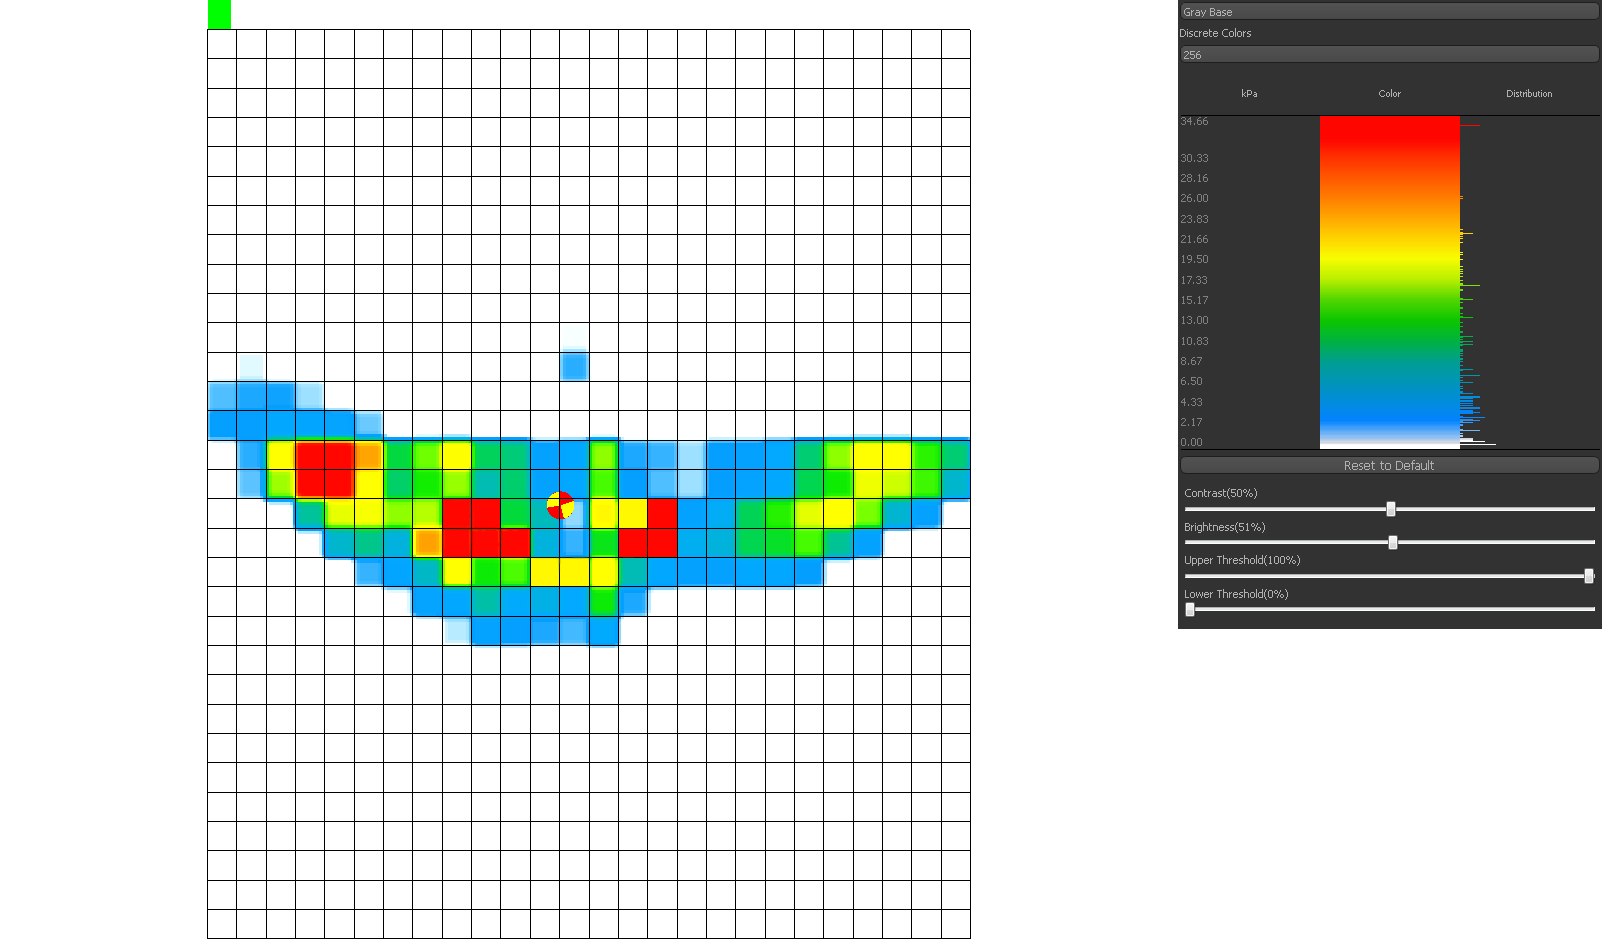
The spine is compressed.
The scapulas are clear
The weight of the rider is very poorly distributed.
The center of gravity is very mobile (visible on video).
The pressure peaks are important due to the lack of cushioning.
Performances
